If I were still working as an elementary media specialist (or even as a high school media specialist), I would now be designing a lesson based on these two electoral maps from last night.
On the top, the Washington Post‘s version of the map of results; below, the New York Times.
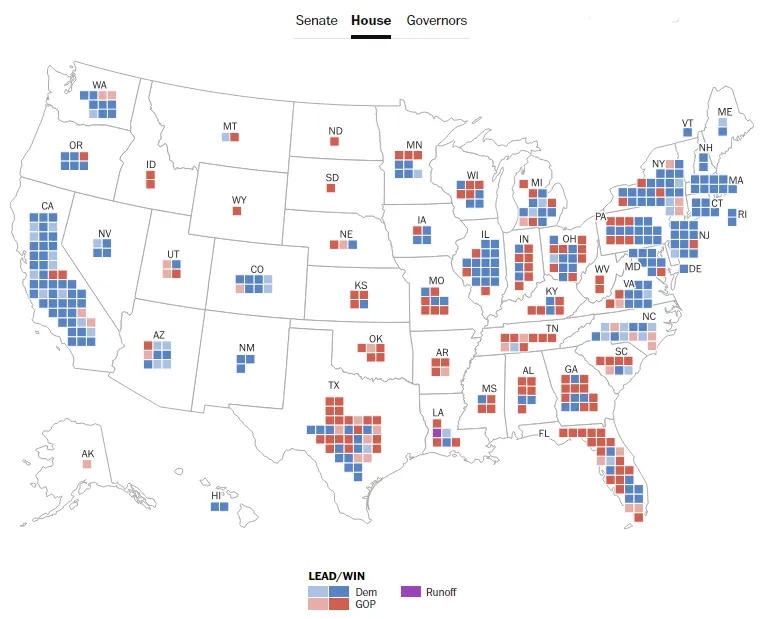
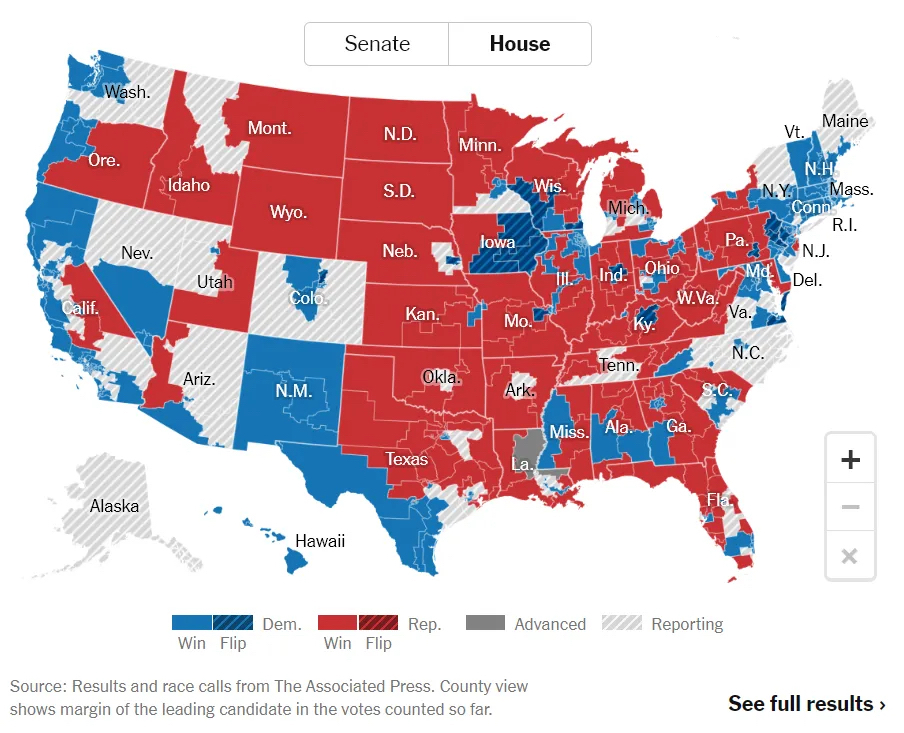
We’re all used to seeing national election results depicted like the NYT has done here: The districts of each state are fully inked in with the prevailing party in that district, and the general impression in looking at that style of map is that the Red Team really crushed it. Look at all that red!
So my lesson for my 4th or 5th grade classes who have been brought to the media center to learn how to find and use information, I would start with the NYT map and ask for the kids’ takes on it.
Then I would ask them how representatives in the House are apportioned, i.e., how do we decide how many representatives each state gets. The answer, of course, is by population as determined by the Census.
The next question would be how many representatives do North Dakota, South Dakota, and Wyoming get? This would tumble straight into our use of The Big 6, a structure to help students find and use information. (N.B.: I didn’t use their “Super 3”; I created my own elementary version of the steps, which you can see here.) The Big 6 would guide them in deciding what sources would be appropriate to find the answer to my question, and so forth.
These days the students could simply use their laptops (or in my media center, one of the dozen computers there) to find the answer, but Back In My Day™ we were still testing for things like atlases and encyclopedias, so I had to make sure they knew how to do that.
However they got the answer, I’d ask them to compare the number of representatives for ND, SD, and WY to CA, NY, or TX.
Finally, I’d hand out the WaPo map and ask them to evaluate that.
Finally, I’d have them analyze both maps and determine which is actually giving them accurate information. Yes, my dice are loaded: The WaPo map is accurate in essential ways that the NYT map isn’t. We can see at a glance that rather than a huge splodge of red in the middle of the country, the actual number of people who live there is miniscule compared to almost any other state. Fewer than a million people live in each of those three states, and even Washington DC has a higher population than Wyoming.
Why would I do this? Because it would teach them to look at how these kinds of things are made, are constructed, and why it might be important for our media to use maps like the WaPo map instead of the NYT. It might save them from ever appearing in a video with the Good Liars and making fools of themselves by believing that the NYT map actually represents the overall success of the Red Team.
(If I wanted to be fair, I could then ask them to explain why a map of Senate representation that looked like the NYT map would actually be valid, but overall the lesson is “Land doesn’t vote; people vote.”)